
Three Real World Applications of Unstructured Data
Welcome to our autumn newsletter!
We are excited to share three recent cases when leveraging unstructured data (datasets that are not stored in a structured database format) from the web helped us answer otherwise impossible questions:
- How can we measure e-commerce performance across products and platforms to enable more strategic decision making?
- How can we efficiently and sustainably define a portfolio of assets that reaches the most unique consumers?
- How can we gauge consumer tastes across categories, including those outside the typical CPG landscape?
Combined, these examples show how we can uncover insights otherwise unavailable from structured sources.
I hope you find this issue insightful and please reach out to us with any questions, or if you feel this work could be relevant to your business (as it should be!).
Vittorio Raimondi
Managing Director, Foresight Associates LLC
Scanning the Digital Shelf – Re-defining Familiar KPIs for the E-Commerce Space
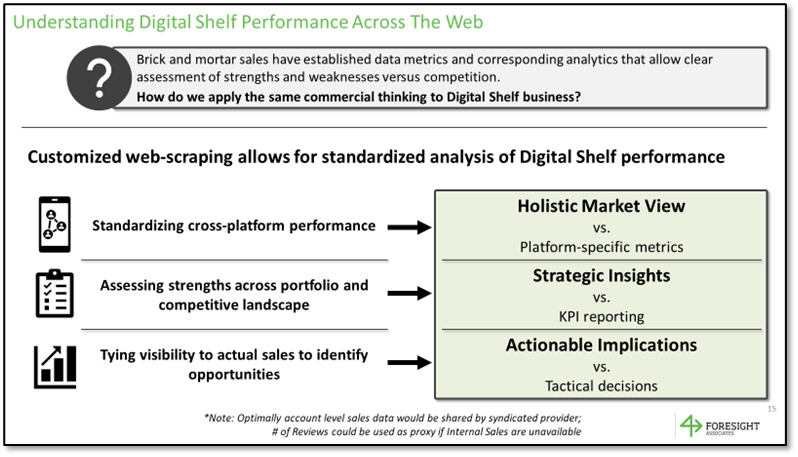
The world of e-commerce provides different dynamics than typical brick & mortar business, and as a result typical performance metrics such as velocity and distribution are not applicable. Yet, the need to quantify and decompose the performance of a given product in e-commerce does not go away!
Question:
How can we measure e-commerce performance across products and platforms to enable more strategic decision making?
Digital Distribution – More Than Just “Share of Search”
One common measure of digital visibility is “Share of Search”, meaning the percentage of search results that contain your product. However, a key aspect missing from SoS is the product position on the page. As discussed in a previous newsletter, 70% of conversion from search happens in the first row of search results.
Solution:
To fully quantify digital shelf distribution, Search Rank must be merged with Share of Search — a combined metric that we have referred to as Visibility.
By considering both breadth and depth in our Visibility metric, we are able to derive an analog of the more traditional Total Distribution Point (TDP) used in brick & mortar businesses: One number that can be easily tracked and benchmarked across platforms, helping teams understand exactly where their product “sits” on the digital shelf.
Digital Velocity – Standardizing E-Commerce Performance to Make Actionable Decisions
Once we’ve accepted Visibility as an analogue for traditional product distribution metrics, that paves the way for leveraging an e-commerce version of another familiar KPI: Sales Velocity.
In traditional sales data, Velocity measures the average sales per point of distribution ($ / TDP). This is especially helpful for standardizing consumer demand across brands, channels, etc. or when comparing two products of drastically different maturity (e.g., an established brand vs. a hot new challenger).
Implications:
Ultimately Digital Shelf Velocity allows us similar advantages: standardizing analysis across e-commerce platforms, identifying which platforms, packs, items, etc. yield the most “bang for buck” in terms of promoted placement.
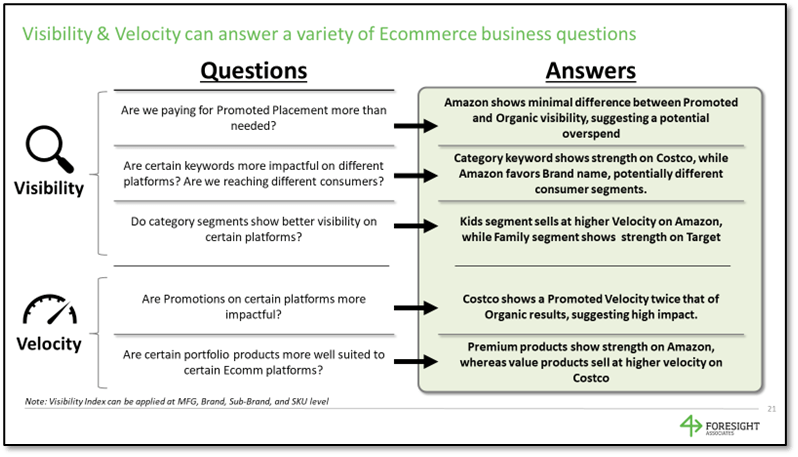
Once quantified, it’s a short walk to leveraging Digital Velocity and beginning to identify key priorities among platforms, brands, and packs (among others), supporting decisions such as the shift of promo investment away from low-performing packs, in order to prioritize less established, but higher velocity items.
Follow The Leader – Quantifying Asset Reach Through Social Media Follower Data
In our Fall 2019 newsletter, we discussed learnings from our sponsorship work, which leveraged custom survey data to help value current and potential assets for our clients. However, such surveys are limited in the number of assets they can cover and can quickly become outdated in our fast-moving popular culture.
Recently one of our clients challenged us to identify and prioritize top sponsorship opportunities for their flagship brand, leading us to a question:
Question:
How can we efficiently and sustainably define a portfolio of assets that reaches the most unique consumers?
Solution:
The geographies in question were developed markets, so we were able to leverage a combination of Facebook, Twitter, and Instagram data, along with an algorithm to account for the penetration and overlap of each platform, in order to estimate the total consumer reach of each asset.
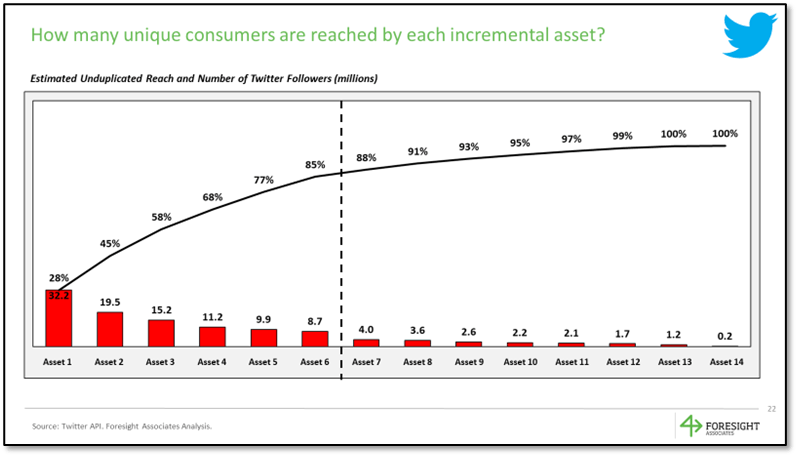
We then used Twitter’s API to scrape the public geographies/locations for fans of different assets to understand how centralized fans were geographically. The higher the geographic coverage of an asset (i.e., cross-market appeal), the higher the potential that the asset could be leveraged across the different geographies where the brand was present.
These two metrics were combined to segment assets into opportunities that were highly relevant (high reach) and highly scalable across markets in the region (low concentration in a single market). This also helped screen out assets that were lower reach OR were overly-concentrated in a single market. Such assets would require signing other assets in more markets, driving up costs and creating a more complex and less scalable asset portfolio.
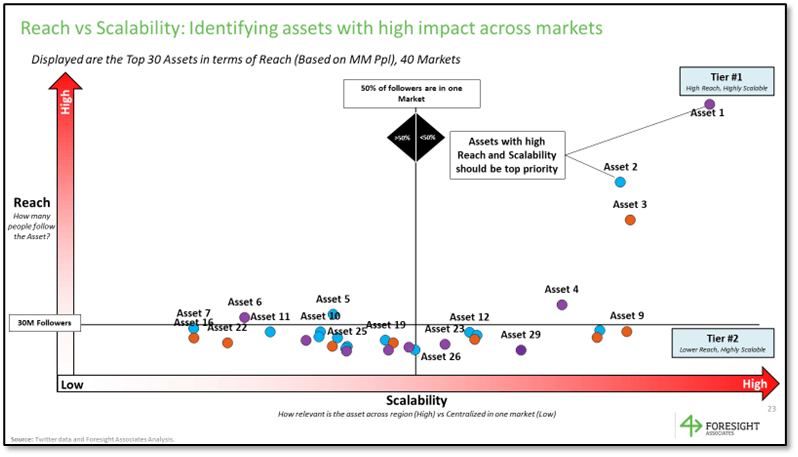
We then used this data to measure how many different assets they would need to sign to reach a critical mass of consumers to maximize their impact and optimize investment levels.
Implications:
The beauty of using unstructured data in this approach is that it can be easily refreshed in coming years to help reprioritize without the need for surveys or additional data sources, providing our client with a simple and actionable strategy that can evolve with our changing cultural landscape.
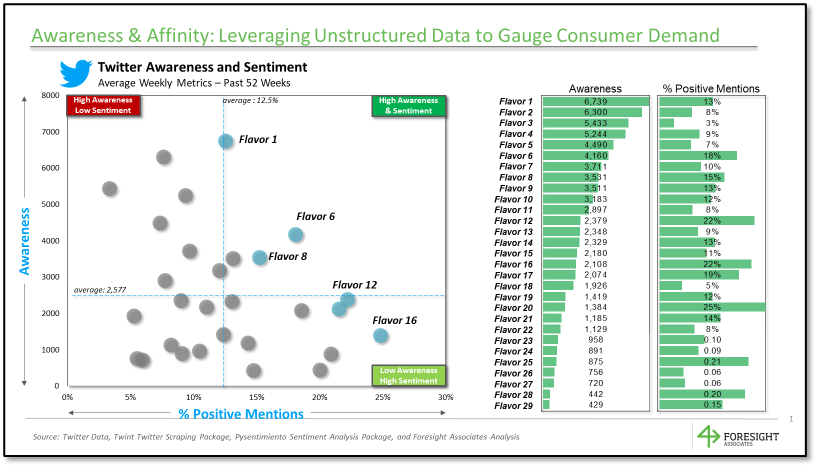
Flavor of the Week - Identifying Consumer Trends Using Web Scraping + Sentiment Analysis
If you’ve ever done market research or attempted to gauge potential appeal of a variety of new products, you may have found yourself frustrated by a lack of available data. Point of sale data and similar sources only capture products and attributes currently or historically available in markets and only for certain channels.
However, true breakthrough innovations within the CPG space are often inspired by trends sparked outside the landscape captured by typical data sources, which can lead to costly primary research to gather the data you need.
Recently, a prominent CPG manufacturer wanted to expand its flavor portfolio and was looking to understand which fruit flavors would be most appealing, including trendy flavors from other categories and potentially flavors outside of the CPG industry entirely.
Question:
How can we gauge consumer tastes across categories, including those outside the typical CPG landscape?
Obviously, such a question required going beyond typical point of sale and survey data.
Can you guess where this is going? Unstructured data to the rescue!
Solution:
We scraped Twitter data going back three years, in order to measure weekly mentions of a wide range of flavors, creating an analogue for a more typical Awareness metric. Comparing Awareness across flavors allowed us to determine which were most relevant to consumers for a large list of flavors, including highly regionalized flavors not typically captured in existing data sources.
Obviously, Awareness is only one dimension, with Affinity adding the other half of the consumer demand equation. Sentiment Analysis provided the solution.
By understanding whether each mention of a flavor was in a positive or negative tone, we could further identify if certain flavors were trendy, but controversial, or growing in popularity and beloved. Ultimately, we identified several familiar flavors that had yet to be adopted in the category of interest, showed high potential for consumer demand.
Implications:
Certainly, unstructured data can only go so far, but it can provide helpful direction in crafting the next steps of your analysis. For example, we then ran a highly targeted survey, asking consumers their purchase intent specifically for those flavors identified as high Awareness and positive Affinity, ultimately leading to a clear recommendation on portfolio composition for our client.
That’s all for now on our continuing journey with using unstructured data. Thank you for reading and please share and reach out if you’d like to know more. We would love to hear your thoughts!
Latest at Foresight
Growing Team: We are continuing to expand our team and are happy to introduce Ramsey Shaffer. Ramsey joined us in July as an Associate.
Semi-Open Office: As the summer winds down, we’re making the most of it here at Foresight! As Minneapolis’ case rate has declined, we have started having optional small get togethers in the office, for those of us who are comfortable and missing our extrovert time. We’ve been making use of nearby Loring Park, working from our rooftop patio, and even enjoying a few good ol’ fashioned whiteboarding sessions in our conference room. We’re remaining flexible as we prepare for the future, but in the meantime, we might play a couple rounds of foosball.
Catch up on our latest research: Visit our website to see other recent examples of our work, or get in touch for help tackling your next big question!