
Impact of Building Blocks for Growth
When it comes to strategic planning, our clients often look for a roadmap for growth that has actionable building blocks they can quantify. Using algorithms developed by our team, our Pachinko™ Model suite of services helps us identify opportunities, prioritize, and evaluate different scenarios so we can better advise clients in making decisions.
Let’s take an example situation. Your objective is to help set a brand’s long-term portfolio ambition and growth strategy. You’d want to predict the existing product line’s growth over the planning time horizon (say, ten years). You’d want to know how much incremental growth comes from different drivers like innovation versus distribution and velocity, which products are going to be more successful, and which markets or channels are going to be more important.
We’d start by:
- Defining “what to achieve” in terms of a financial ambition for the product line
- Quantifying “where to play” through identifying categories, segments of the market, and business drivers that will allow us to achieve that ambition
- Clarifying the “how to win” in terms of specific occasions, packs, pricing, and innovation concepts that are most relevant for those choices
- Identifying resources needed to achieve this ambition and recommended budget
And then we’d simulate a ten-year growth timeline.
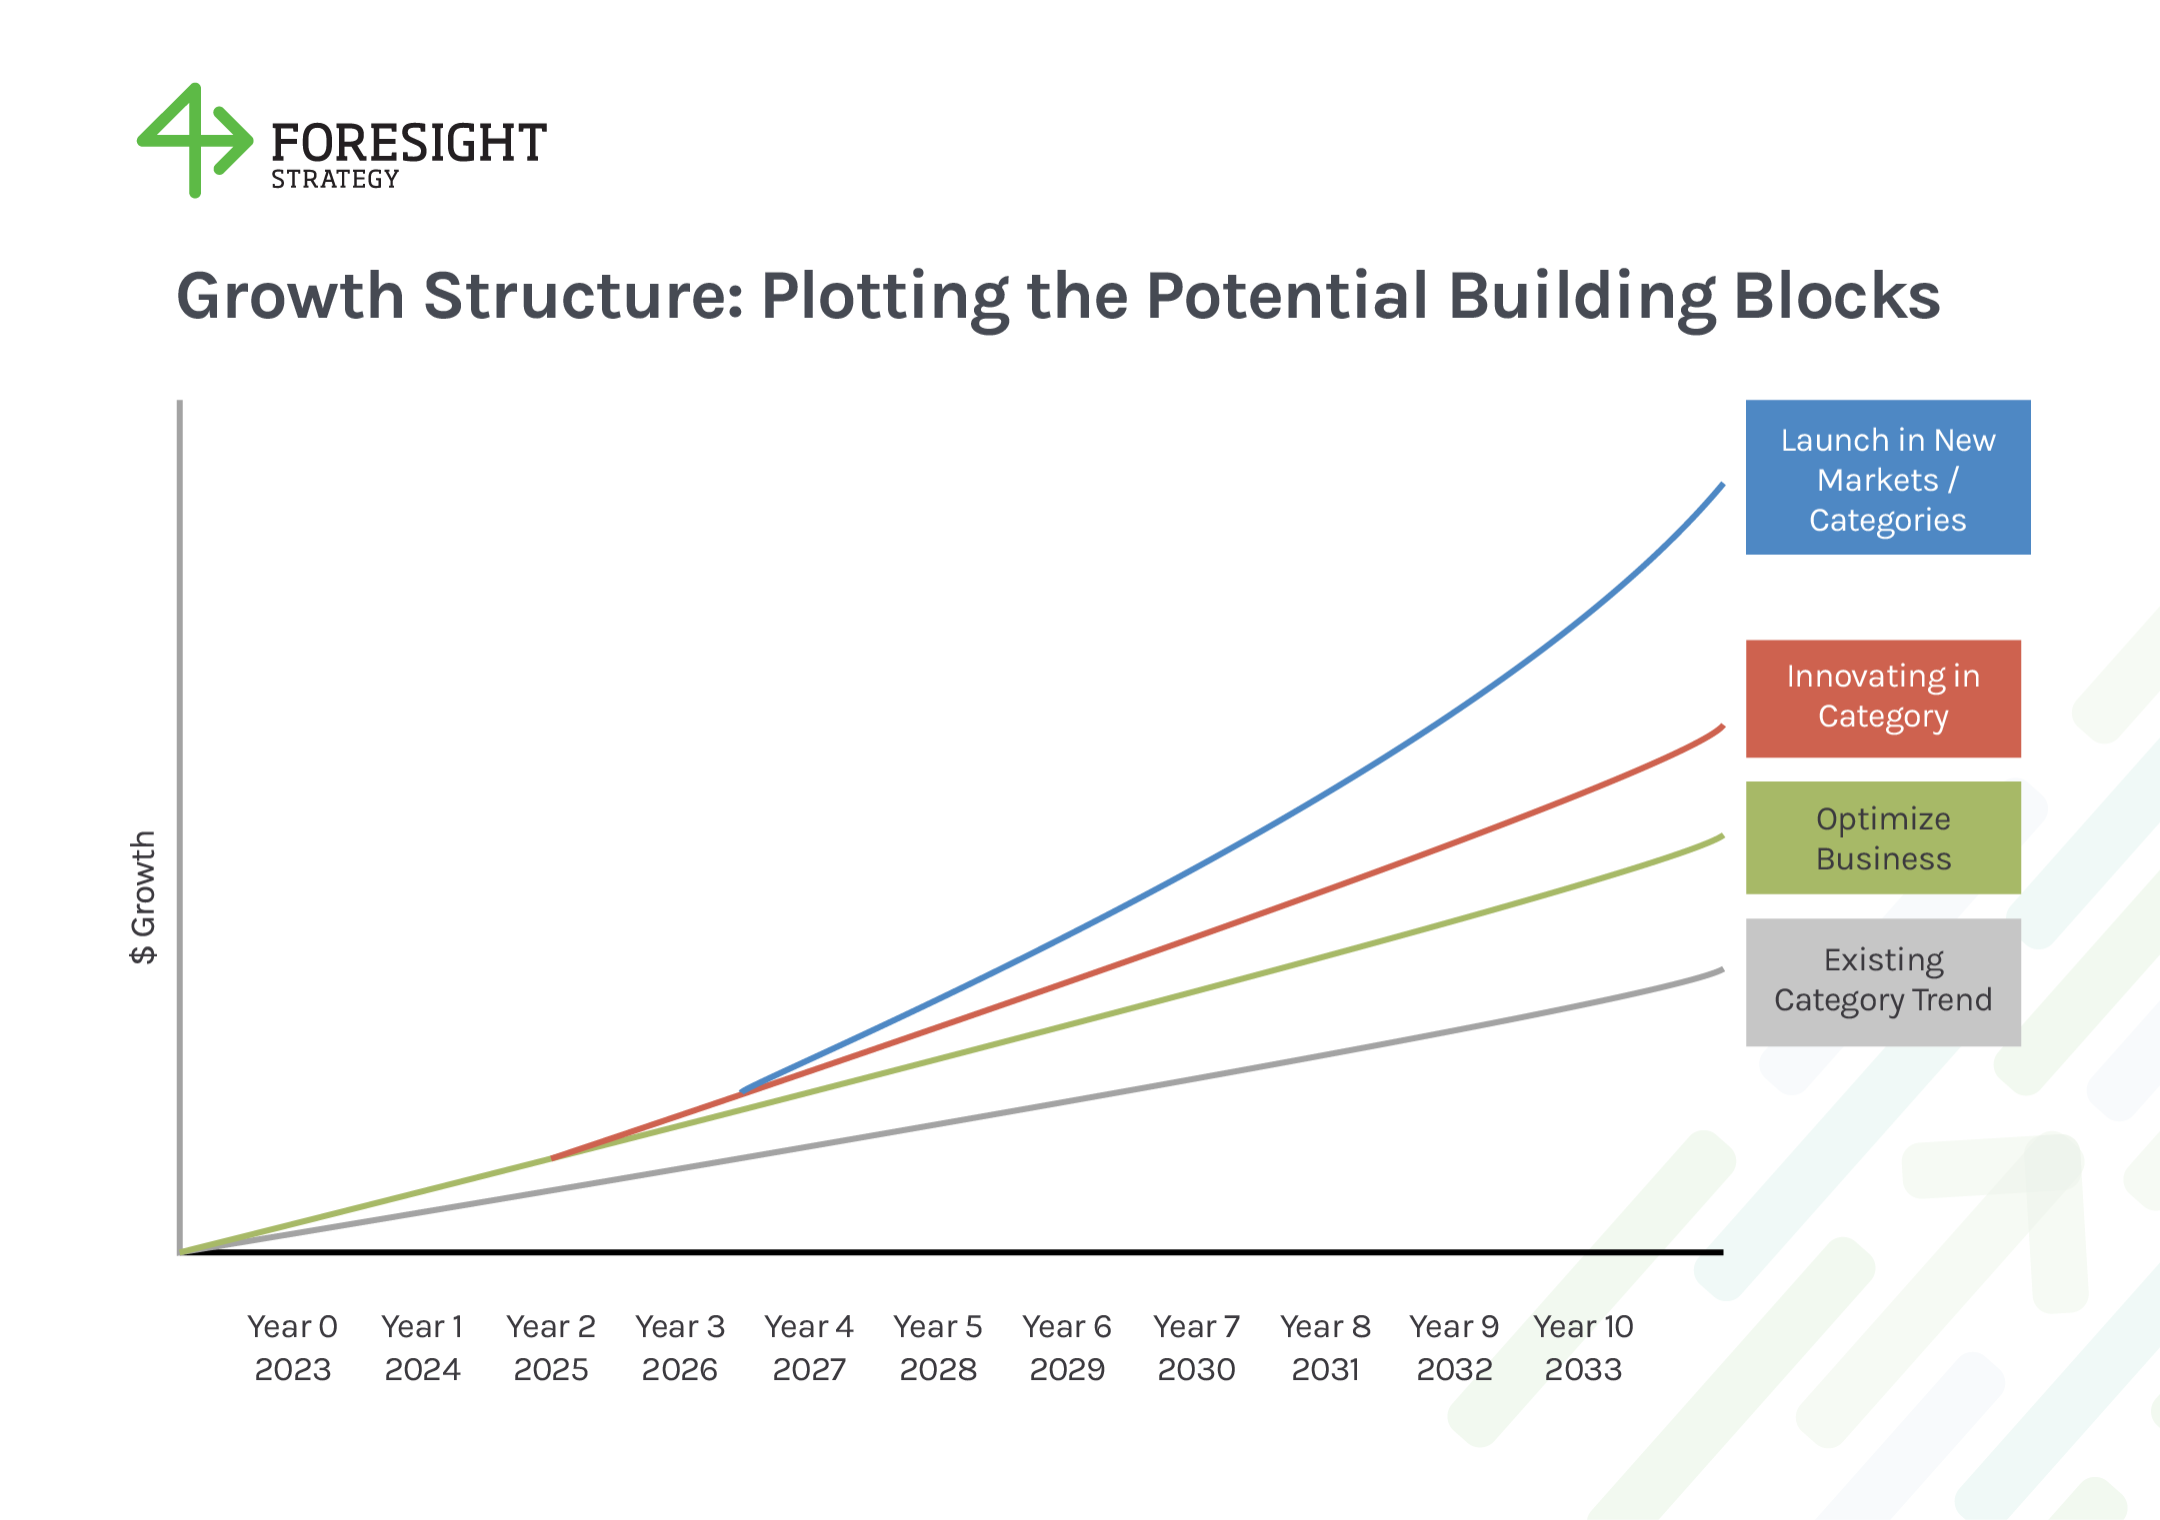
- Gray line: what would happen assuming you do nothing and continue as you are
- Green line: what would happen if you optimized your existing business based on benchmarking
- Red line: what would happen if you started innovating
- Blue line: what would happen if you launched into new markets or adjacent categories to the current business
Defining Forward-looking Opportunities
In our experience, growth opportunity can be quantified by three factors:
- Category trend: the expected growth (or decline) based on historical trends (and qualitative judgment)
- Closing a gap to the market leader: the potential to grow beyond category trends in terms of Key Performance Indicators (KPIs) like innovation, distribution, velocity, and premiumization
- Ability to move a KPI: the feasibility of improving those drivers over the time horizon, based on what we’ve observed in the market
The Pachinko™ Model estimates and synthesizes these opportunities, including interactions between the drivers and what the expected share brands could get by entering spaces they do not currently play in. The model also sizes up what is realistic to achieve in a category in a set time frame and defines the KPIs that are needed to achieve each growth milestone.
These informed simulations allow for adjustments and can be as granular as needed so you can see how small alterations would play out.
There are three key benefits of taking this approach:
- It’s grounded in data – you get to see an informed scenario (based on as much available evidence as you can use – historical contribution of drivers to your growth, category trends, real brand examples, competitors)
- It uncovers pockets of opportunities – even if you’re the market leader, the model still finds opportunities (channels, segments, pack roles) you may not have realized you had
- It includes workshopping – the numbers aren’t everything, a big part of the approach is customization, reiteration, and co-creation with stakeholders who are now aligned to the assumptions and targets
Real-life Results
“The Pachinko™ Model helped us disaggregate drivers of growth in ways we hadn’t seen before. It opened our eyes to new ways we could drive growth for one of our biggest brands while serving as a foundation for the size of the prize. We’ve used the results as an input to help shape our long-term strategy for this brand.”
Senior Director Strategy, Fortune 500 Food Company