Breaking the averages: seven learnings to identify long-term CPG implications in the pandemic
Hello,
Good morning, and welcome to our (nearly) winter newsletter. We have two exciting announcements this time around: first, we have just launched our new company website! Check it out and let us know what you think.
Second, we will be presenting in the Insights Association CONVERGE 2020 Conference. Their mantra is exactly in line with our own philosophy on the role analytics should play in growth strategy: “This rapidly changing world needs current, holistic insights more than ever. Market research, data science and analytics teams must come together to uncover, communicate and implement these insights… to advance teams and companies from being data driven to insight driven.”
We will first share insights from our primary research on changes of US shopping behaviors during the peak of the first COVID wave. We will then share the findings from a more recent study with Kellogg’s, aimed at predicting the impact due to COVID for the snack bars category, using data such as geolocation and stringency. It revealed the need for deeper portfolio and consumer understanding to inform growth strategy in a post-pandemic world.
I hope you enjoy reading a few of the lessons in this issue, and will join our webinar where we share the full presentation: “Breaking Averages: The Importance of Good Product & Consumer Segmentations to PredictCOVID’s Impact on Shoppers”.
The session will be Tuesday, December 1st from 3:20pm to 3:45pm EST. You can click here to register online for the conference (no cost until at least November 20 and possibly beyond), and be sure to check out the other fascinating topics as well.
Please feel free to reach out to us with any questions, or if you feel this work could be relevant to your business!
Vittorio Raimondi
Managing Director, Foresight Associates LLC
Out with the old, in with the new website!
Yesterday, we launched the new 4sightassociates.com, in partnership with KNOCK, a local Minneapolis creative agency – thank you for the amazing work, best agency we have ever worked with! Key highlights of the new site include:
- Launch of “The Latest” blog with content including this and prior newsletters, conference participation and related media, and community involvement updates
- Updated capabilities overview and case studies for our key tools and frameworks
- New client testimonials
- New careers page and role descriptions for prospective candidates
- Profiles of our leadership team and staff spotlights
- Updated visual style and mobile optimized user experience
Thank you to all who have supported us in this journey, and we look forward to staying in touch as we continue to build and improve our content.
Using structured and unstructured data to predict what pandemic changes will stick
2020 has been a year of unprecedented ambiguity. The world is changing, and existing trends like the rise of e-commerce and remote work have accelerated and perhaps fundamentally shifted to a new normal. But in the fog of crisis, and now with promising vaccines on the horizon, it has been a challenge for companies to identify what are the meaningful takeaways for long-term growth strategy.
Here are seven learnings we’ve found about using data to identify long-term implications for a CPG category in the pandemic – from both the data analyst and the brand strategist point of view. For the data analysts…
- Get in the weeds with your sales data. Any rolling numbers from 2020 need to be interrogated to ensure that your sales trend is not lost in the noise of the “panic buy” from the beginning of the pandemic. This time period occurred in different markets at different times and to different degrees, but there was usually a several week period in which CPG products saw an unprecedented spike that makes the overall year look very, very good. Does that mean that demand for these products will continue to be as strong several years in the future? Unlikely. To properly gauge the impact of the pandemic, we recommend diving into the weekly sales data to break the year into the “pre-period”, the“outbreak”, and the “post-period”. A rule of thumb that has worked for us is to consider the five weeks following the first COVID death in a market as the “outbreak”, and then compare the pre and post periods. This will tend to show a return to some sort of baseline in weekly sales which can give you amore rational picture of how the world might continue to look.

2. Take advantage of public sources. The silver lining of a pandemic, from a data analyst point of view, is that the data to understand it is generally free and available! Public health data from institutions such as Oxford University can be used to track case counts and deaths in order to identify the pre/breakout/post periods and their severity. Oxford University also publishes “stringency” data in its “Coronavirus Government Response Tracker” that converts the strictness of regulations and closures into a one number score, trended over time, for each country –for 18 key indicators (e.g. workplace vs. schools vs.travel restrictions) – and they have recently released US state level datasets as well. Google offers free global Mobility data down to the metro area in many cases, showing aggregate levels of traffic each day in locations like workplaces, grocery stores, parks, etc. Tracking consumer behavior has always been vital for CPG companies, even more so during these times of changing habits, and much of the data organizations need to understand those changes is publicly available online.
3. Work smart to reduce complexity and see forward. Now that you have got all this data – potentially tens or hundreds of indicators – what does it mean? Fairly standard statistical analysis allows us to identify which factors (cases, stringency, mobility, etc.) are most correlated with your weekly sales trends. For instance, you might see that mobility traffic in schools is highly correlated with your sales –when that traffic disappears, so does your volume. A diligent analysis will likely uncover significant multicollinearity amongst these variables (in laymen terms, they all move together) which should allow you to hone down to only a few distinct KPIs. Crucially, you can segment markets with different levels of success in re-opening to provide case studies for what happens when those indicators return to normal.This allows you to “see into the future” and extrapolate your own sales forward.

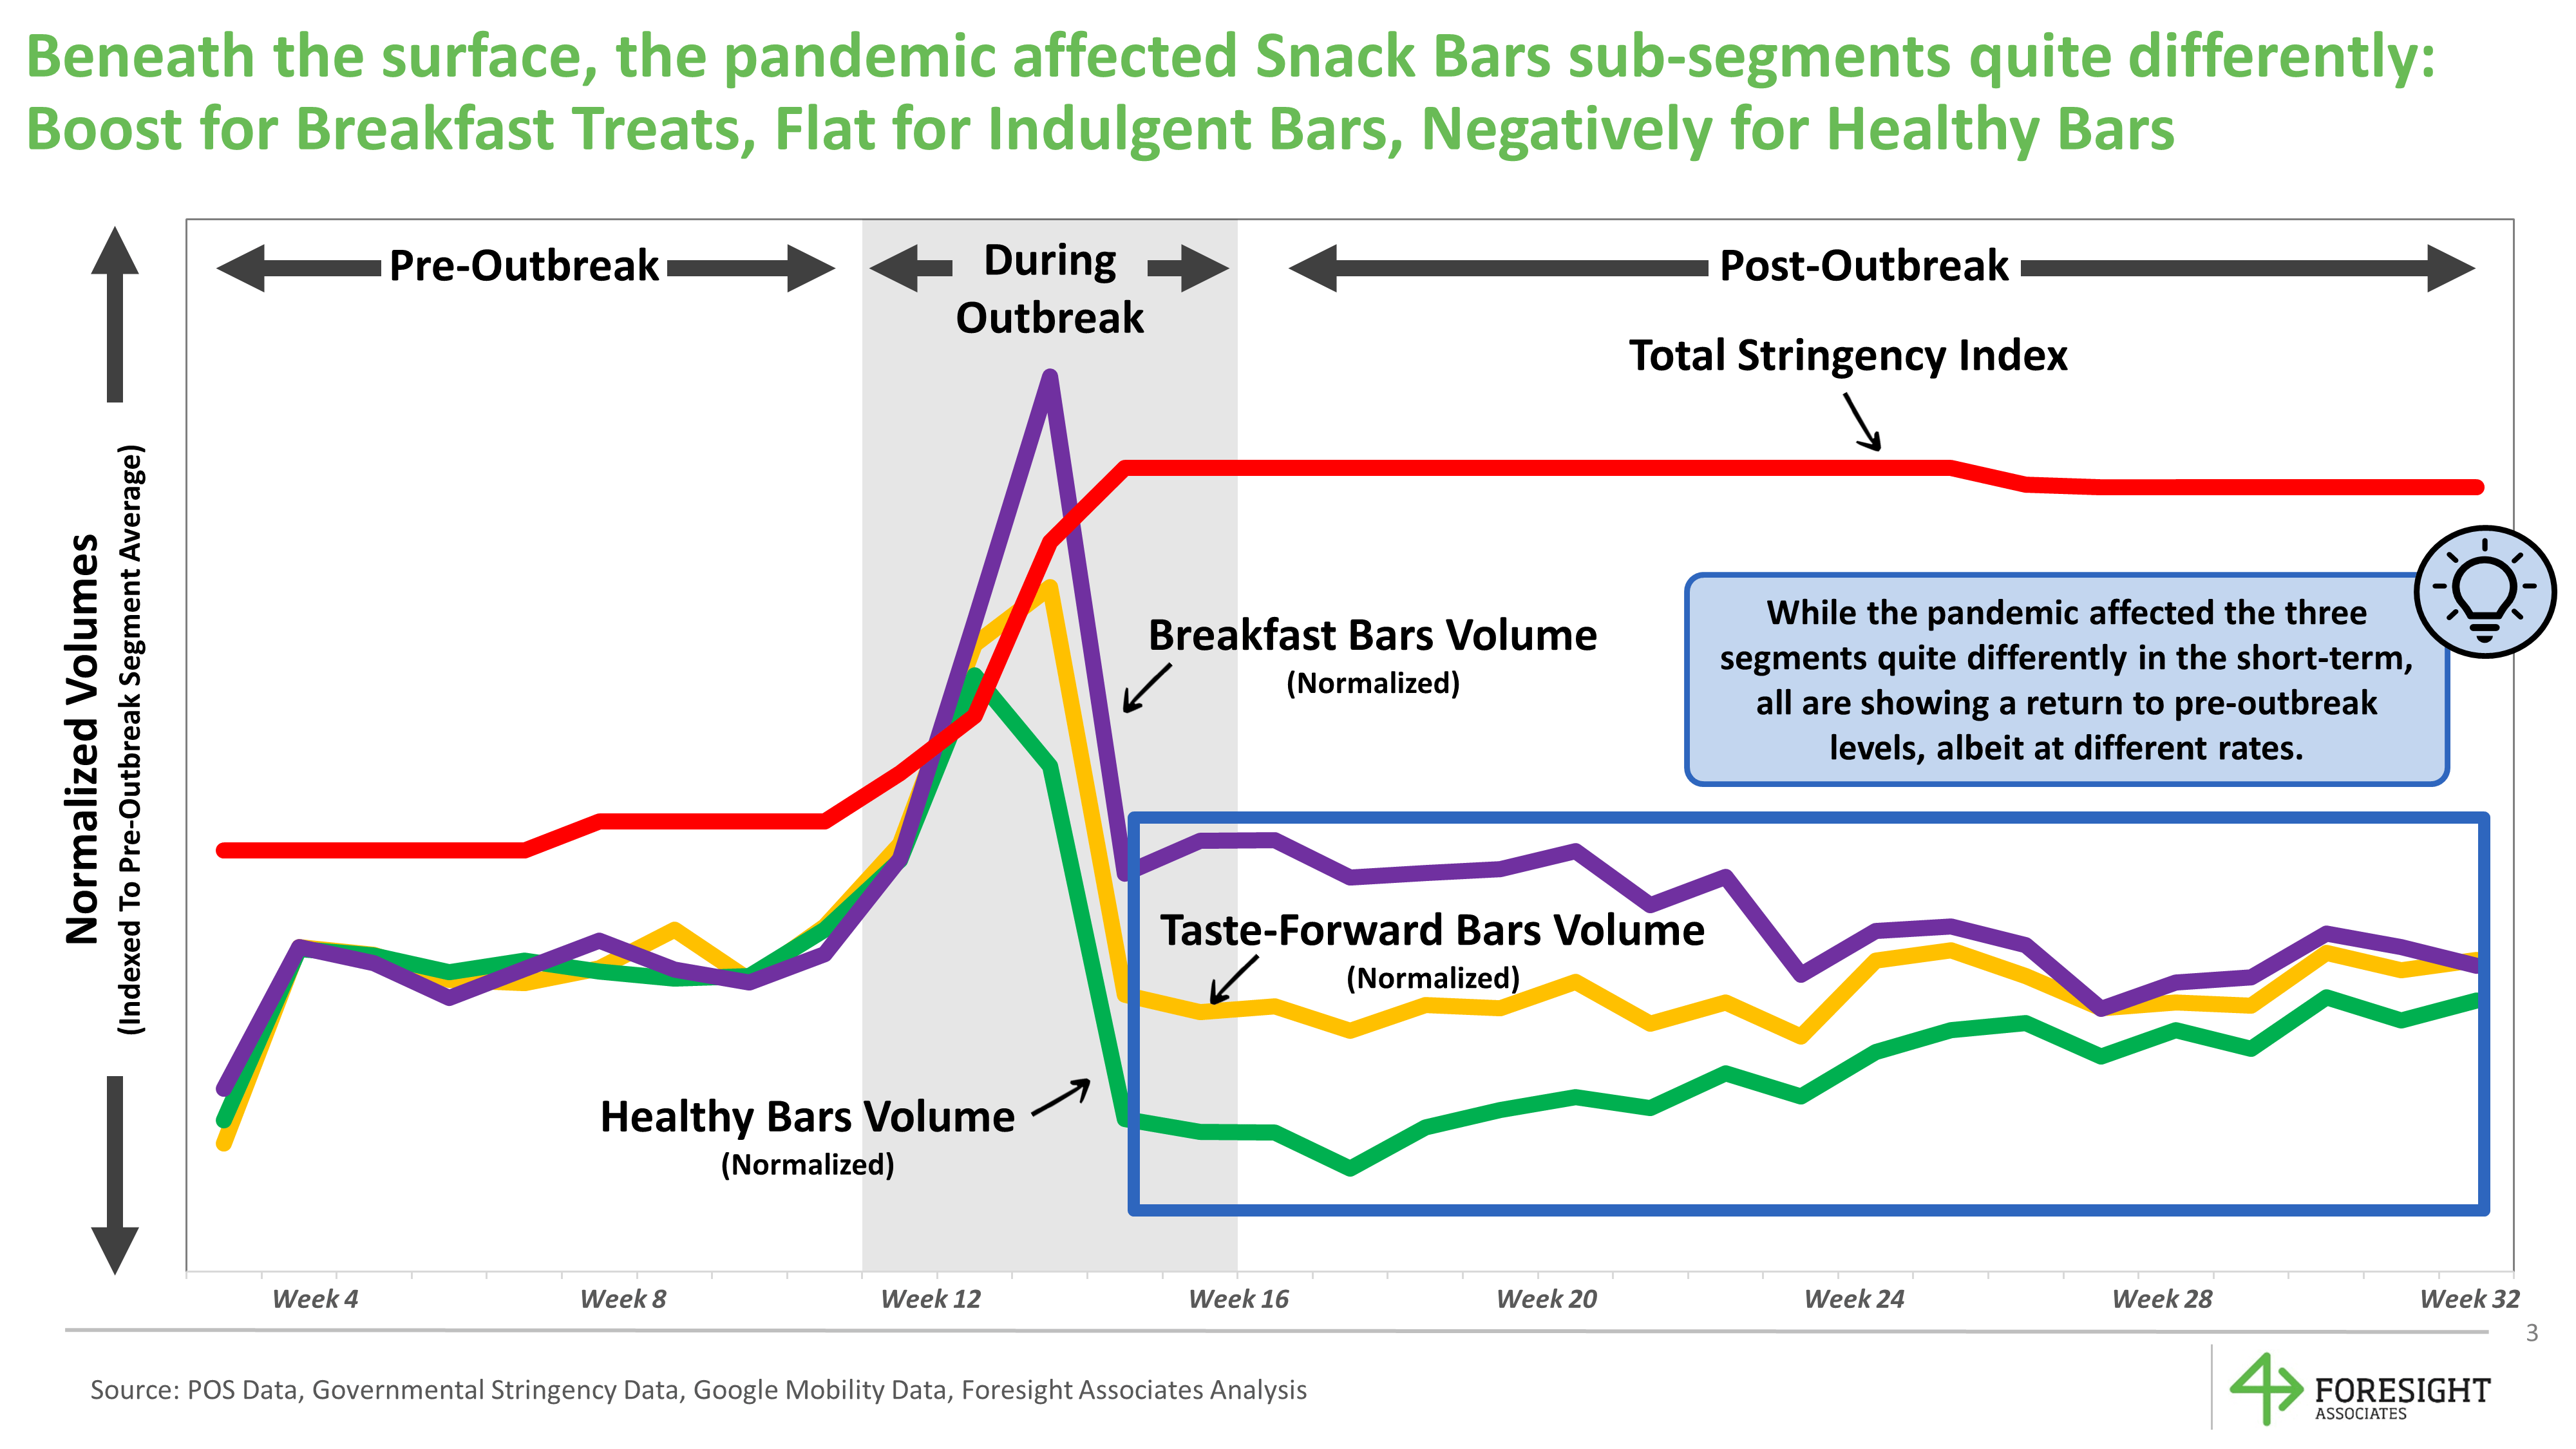
4. Claimed data can provide valuable context. We all know that survey data isn’t perfect – which is why we rarely trust it simply at face value, preferring instead to triangulate with hard metrics like shipments for our modeling. But in times of uncertainty, claimed data can still be useful to understand which way the wind is blowing. Back in April, we ran a study asking consumers in simple terms how they planned to change their behaviors during the pandemic. One of the most interesting findings for food and beverage was a strong positive intention towards “healthy” behaviors (eating fruits/vegetables, cooking meals at home, sitting down to eat with family) but a “polarized” intention towards “taste-forward” behaviors (drinking soda or alcohol, eating sweets or salty snacks, etc.) – with equal numbers of increasers and decreasers. In our work a few months later on the snack bars category, we saw this come to light in the sales data:on-the-go products positioned as “healthy” saw a large negative impact (as people substituted home cooked healthy behaviors), but on-the-go products positioned as “indulgent” were essentially unimpacted. The claimed data in this case provided a valuable window into the future and what to expect.
And for the brand strategists…
5. Segment now more than ever. Not all categories have been impacted by the pandemic in the same way, and that extends to sub-segments within a category. In the spirit of getting into the weeds, it’s important to move away from averages and aggregated data and instead get to the lowest common denominator in your product segmentations. For instance, in the aforementioned “taste-forward” segment, top line trends appear unimpacted by the pandemic. But if we cut one level deeper, we can identify a large sub-segment of breakfast-based products that saw a positive lift from the pandemic (even in the“post” panic period). Not only that, but pre-outbreak growth trends had only gained steam over time as new habits formed. This realization helped our clients re-prioritize this business for the future. Consider sub-segments and cleavages within the business that may be unique to a category, as well as common themes like premium vs. value, and single vs. multi-pack.

6. Remember the behaviors driving the trends. Behind every sale is an actual person making a specific choice for a specific need and occasion. In the bars category, we saw a surprising reversal of trends: the“healthy” products that had been accelerating were suddenly plateaued or declining in the post-period; the large “taste-forward” segment halted its earlier decline. In this case, there is a relatively simple occasion story at play: these “healthy” products, primarily consumed as snacks away from home, have been swapped out because the occasion does not exist during lockdown for many working parents and children. As soon as the lockdowns end, and more-or-less normal life resumes, we should expect this occasion to come roaring back. On the other end of the spectrum, the breakfast-based indulgent products that have accelerated during the pandemic represent a new mealtime habit for children, which will likely be stickier in the long-run.
7. Stay nimble but invest for the future today. With all of the short-term noise in purchasing patterns, companies have had to adjust on the fly to radically different demand than their forecasts would have suggested and different channel mixes than their supply chains or marketing teams were prepared for.Surely there is much to capitalize on in the heat of the moment that might fly in the face of prior wisdom– remember our declining ‘healthy’ bars category. But portfolio managers need to stay clear-eyed and avoid the classic blunder of prioritizing today’s cash cow over tomorrow’s growth engine. If your rising stars are seeing temporary decline due to the pandemic, and you have strong reason to believe that demand will return (perhaps based on the factors we’ve discussed in this article!), make sure that you continue the pipeline of innovation, brand and trade investment to capitalize in the long haul when we emerge in the post-pandemic future. In five years, you do not want to be stuck selling yesterday’s news.
In the upcoming CONVERGE conference, hosted online by the Insights Association, we will expand on these learnings and co-present a case study from work done with Kellogg’s in the webinar entitled “Breaking Averages: The Importance of Good Product & Consumer Segmentations to Predict COVID’s Impact onShoppers” .
The session will be Tuesday, December 1st from 3:20pm to 3:45pm EST. You can click here to register online for the conference (no cost until November 20), and be sure to check out the other fascinating topics as well.